EMEA Office
Louizalaan 489
1050 Brussels
Belgium
Discover what's late and why. Visualize all your late items over time (late sign-offs, actions, training…), and discover which processes need more attention.
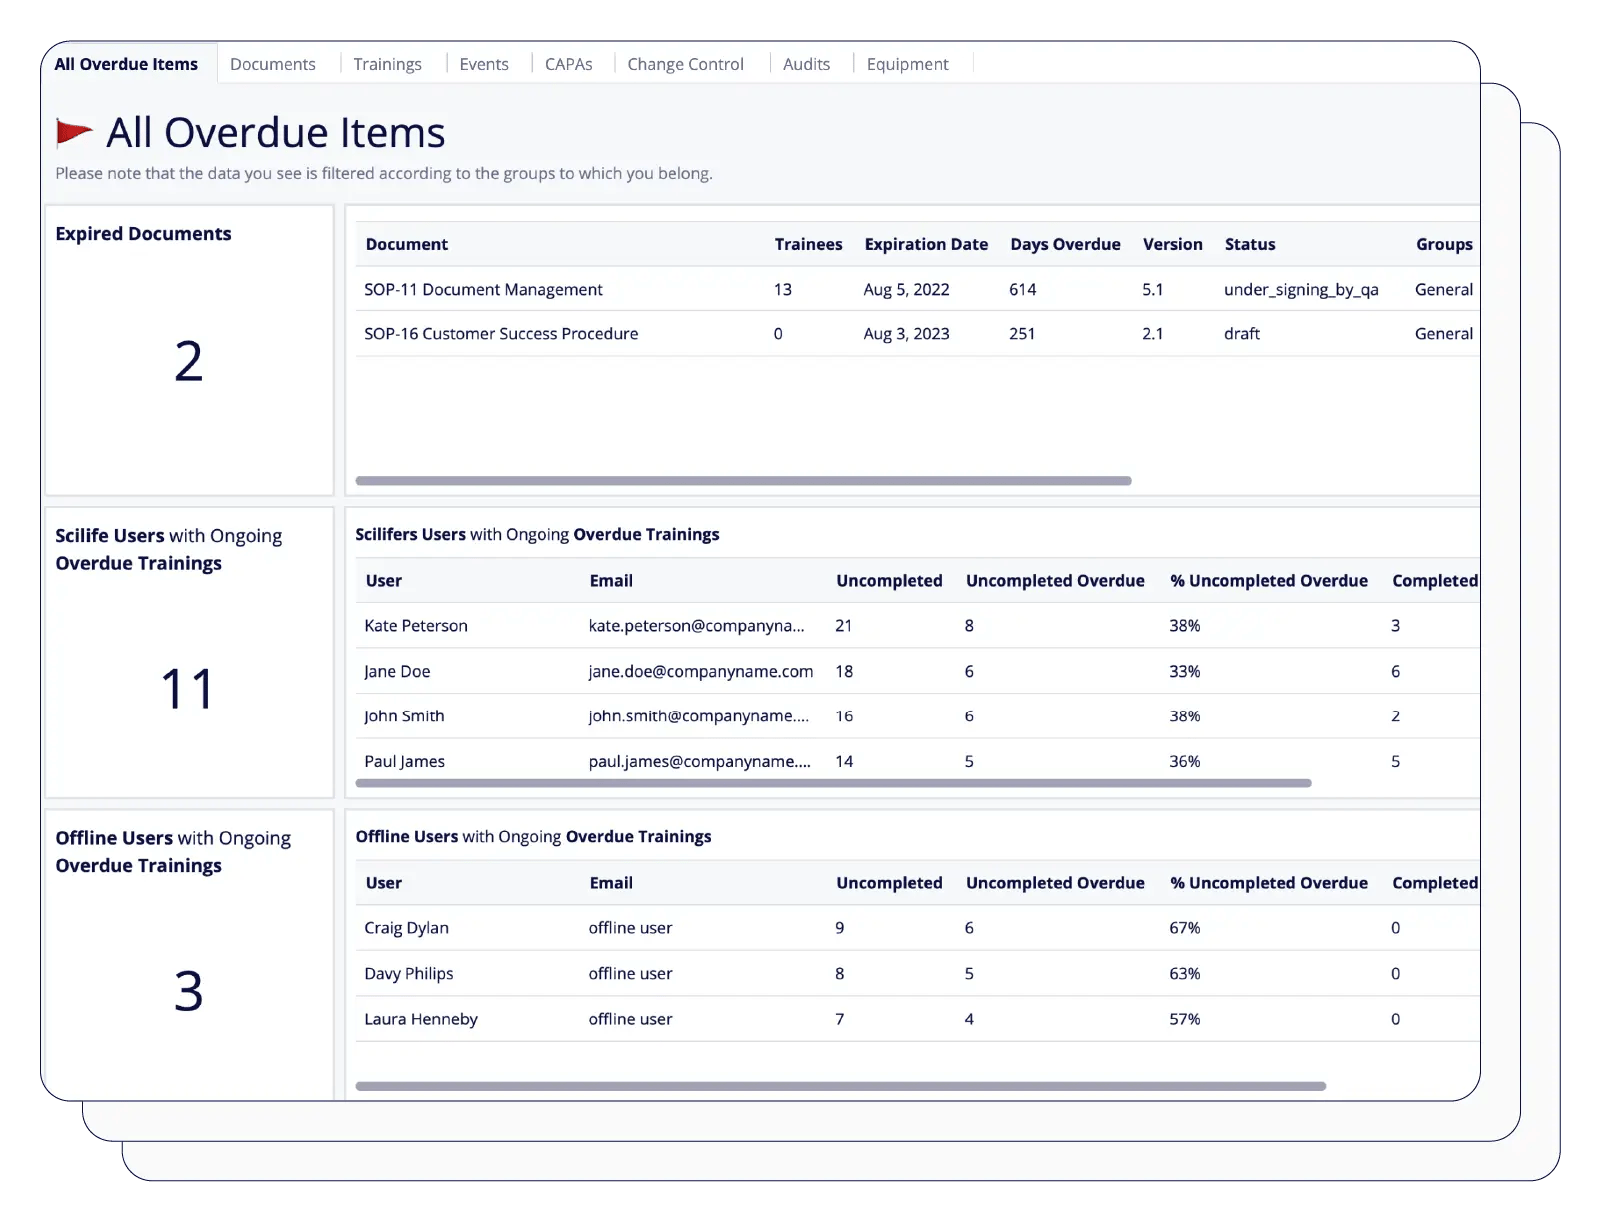
Extract the data and insights you need in a few clicks. Visualize and track your progress, and spot patterns to improve efficiency and performance.
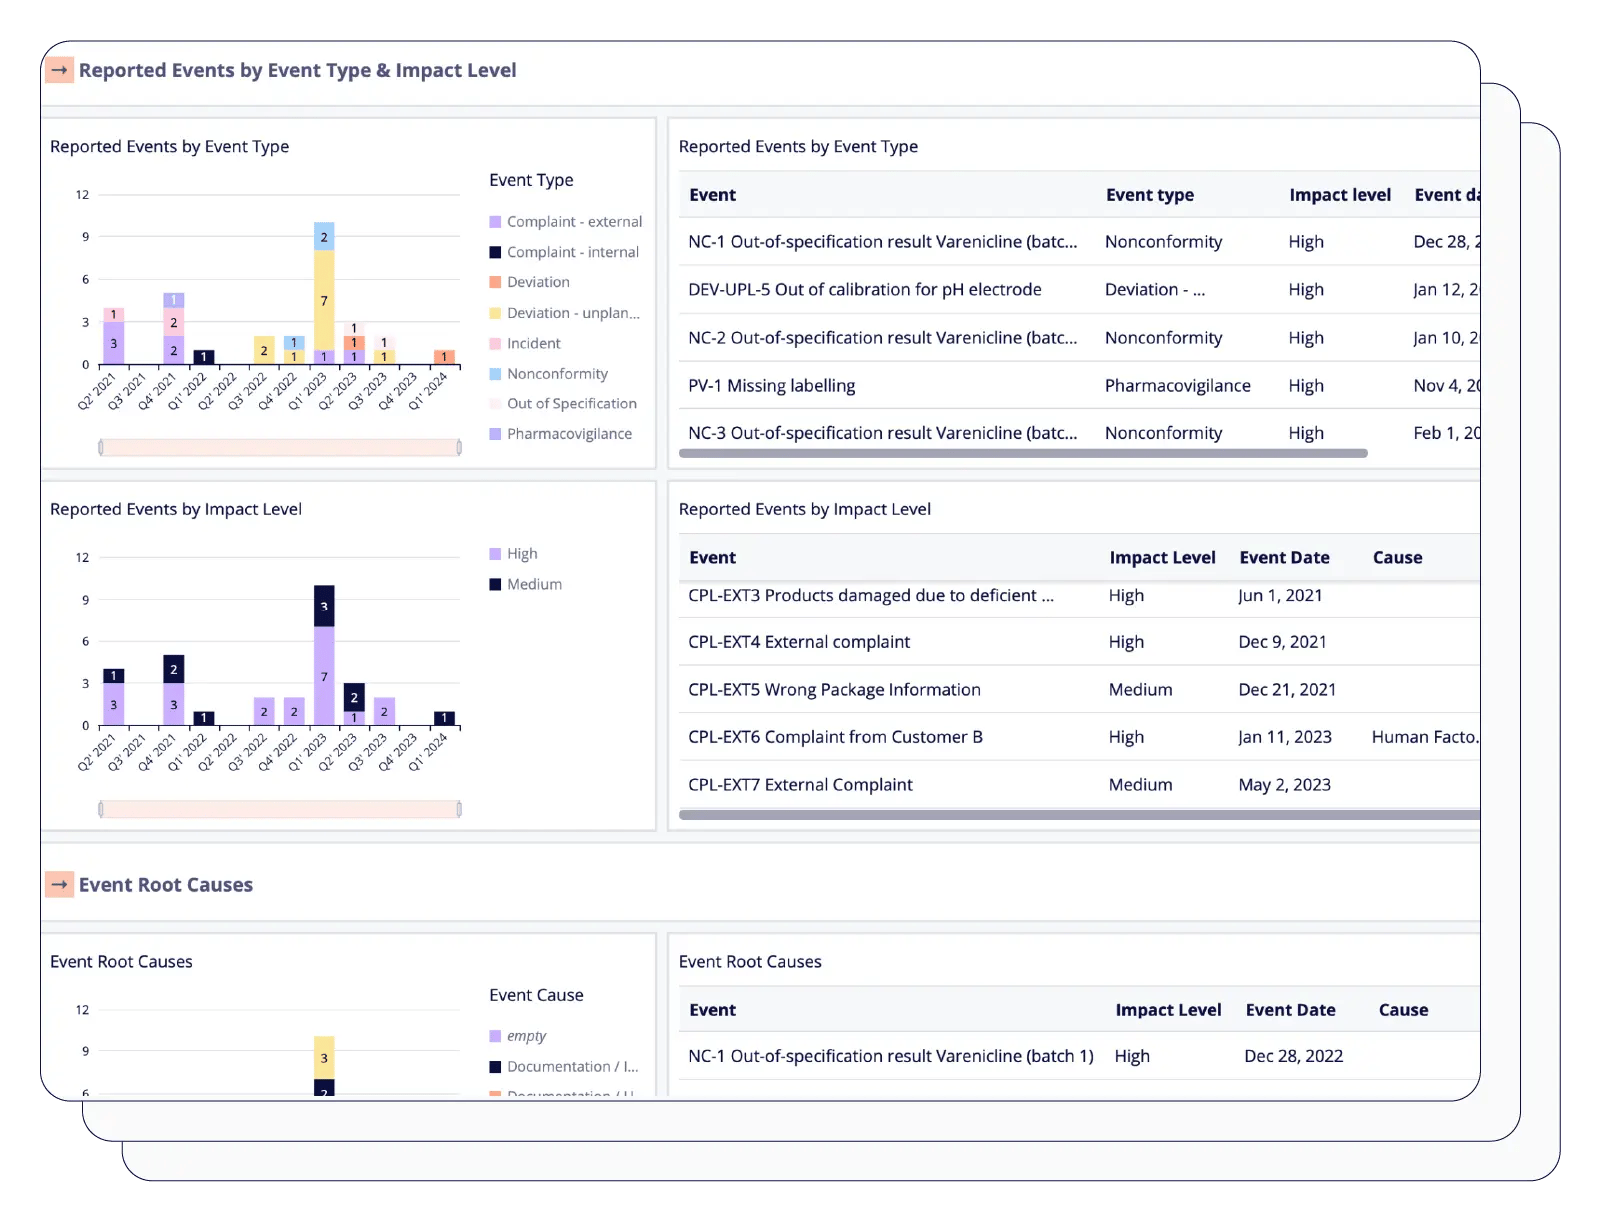
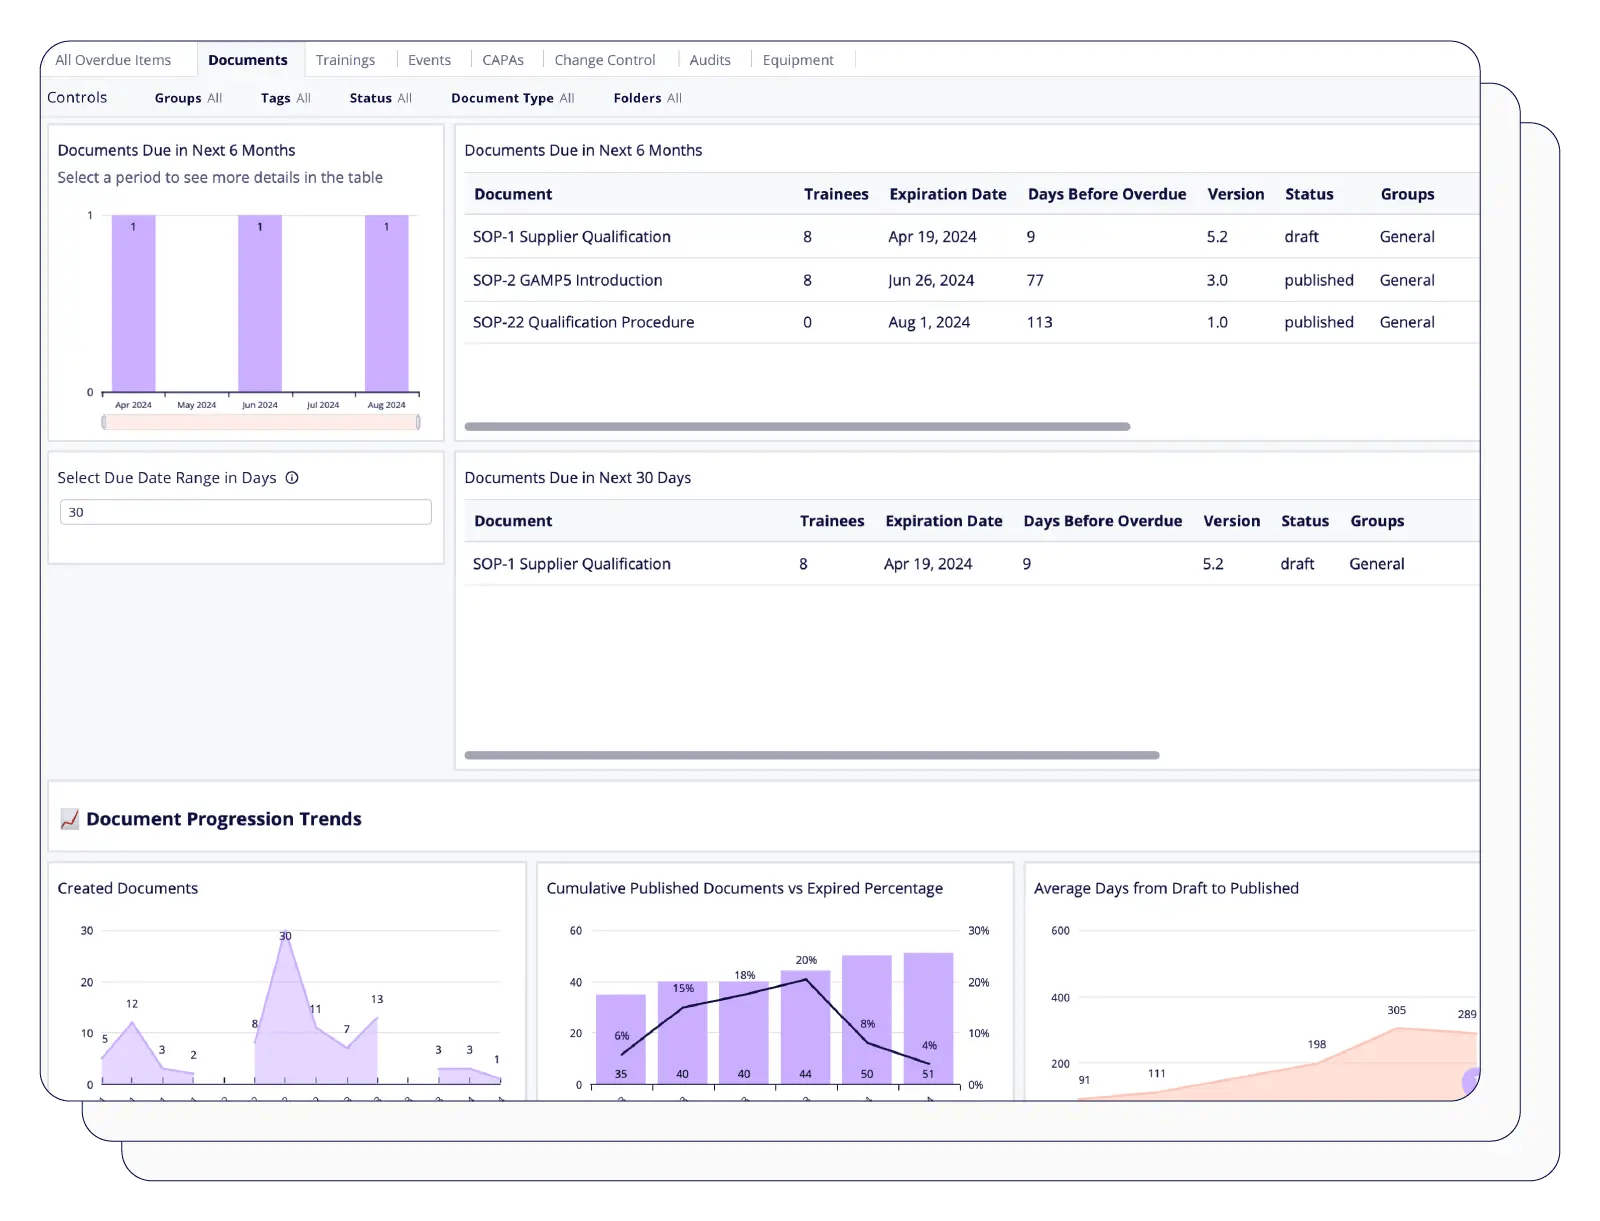
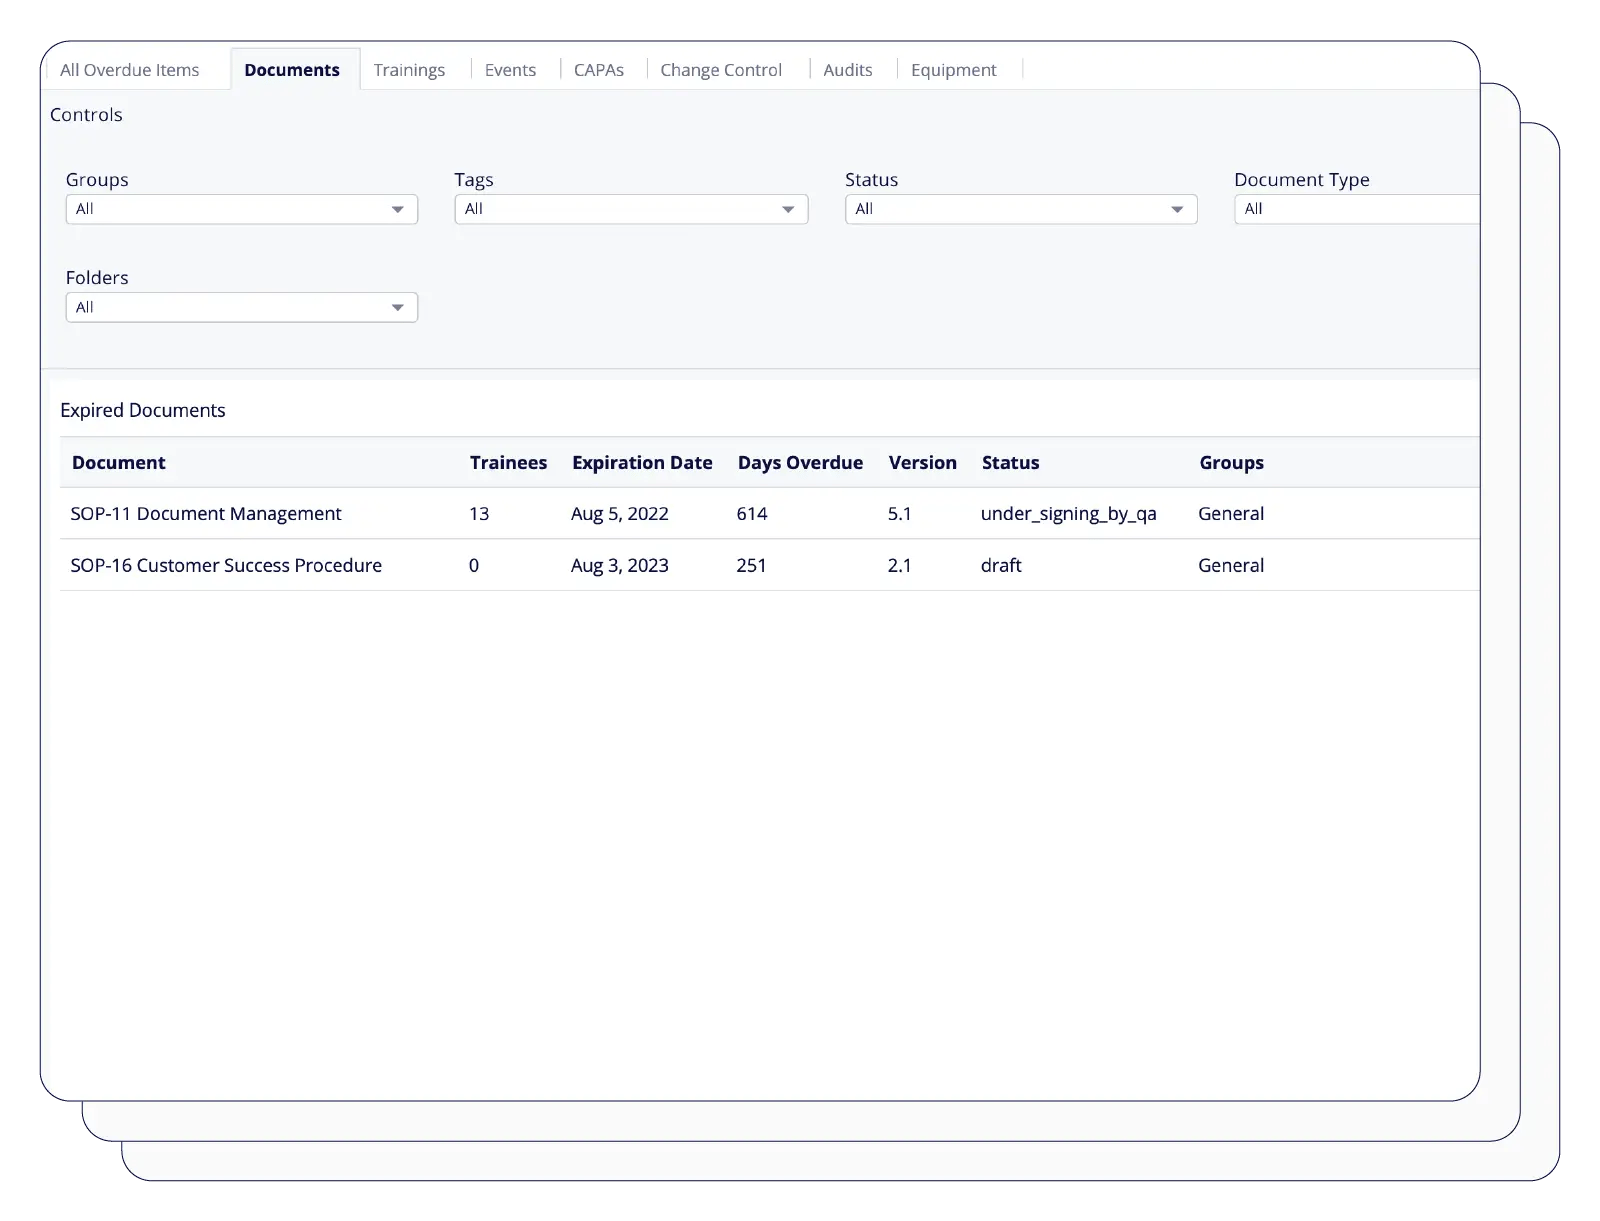
Address any issues related to your CAPAs, documents, trainings, events, audits, or change control, by getting tailored and detailed graphs for each quality process.
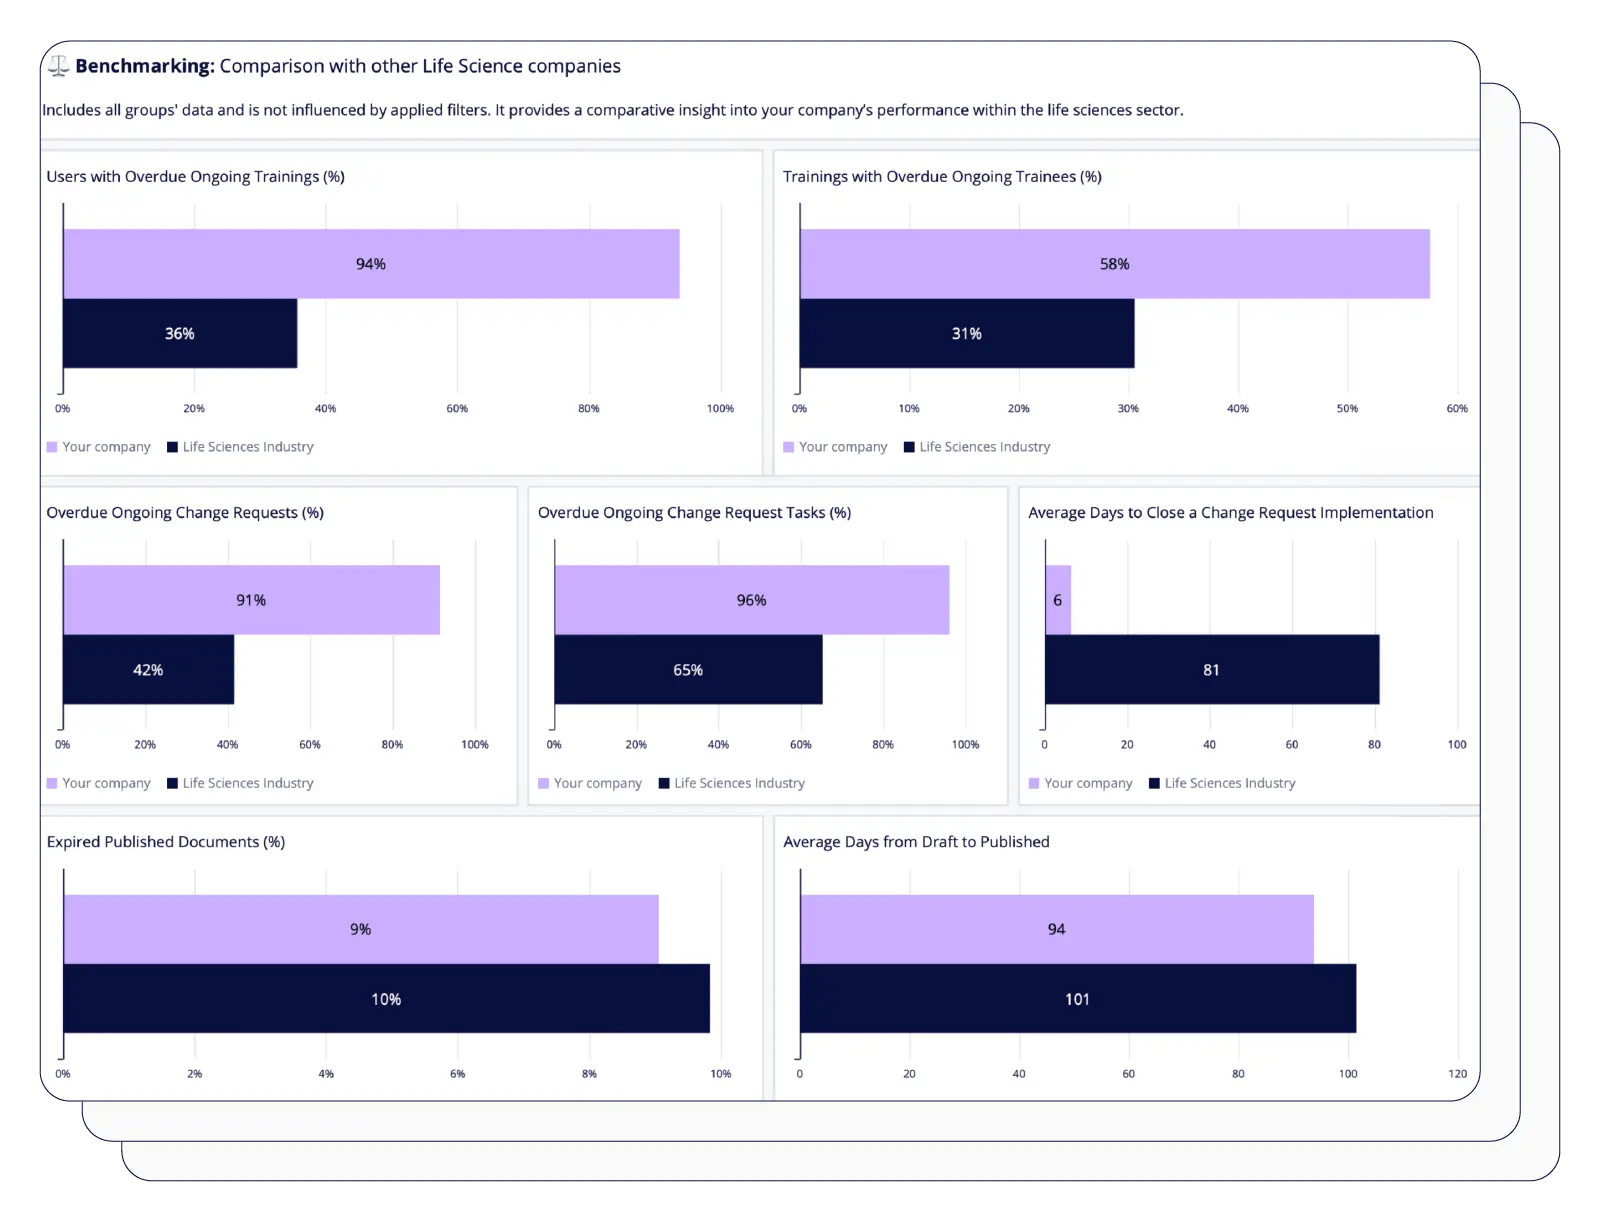
Measure your progress against others with industry benchmarks and find whether there’s room for improvement or you can aim higher.
All your KPI graphs, tables, and insights can be easily exported in CSV format, ensuring compatibility with external data analysis tools.
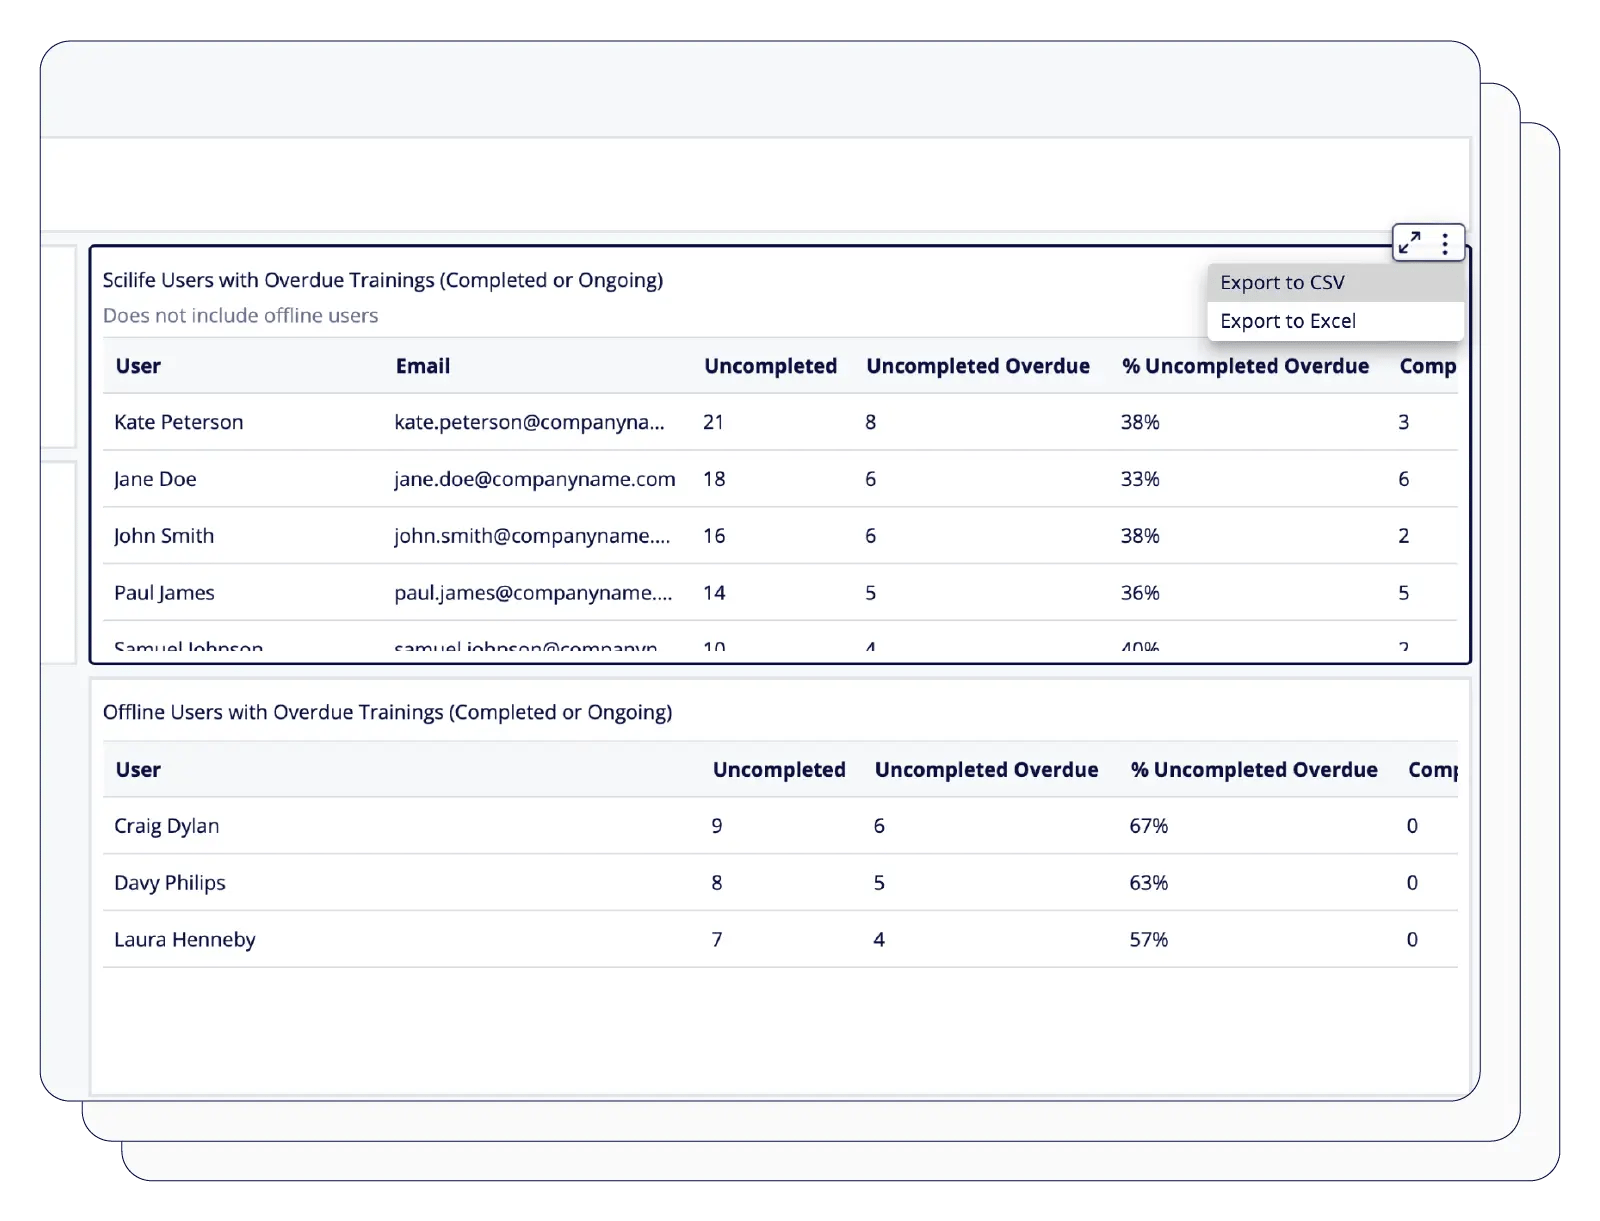
Fine-tune the information through data drill-down and filtering. See data on a quarterly, monthly, weekly, and daily basis, and analyze every detail through clickable graphs.
A typical KPI report in Scilife could be a bar chart that shows the number of documents published in a given period.
In Scilife, you can effortlessly access a suite of predefined KPI reports to provide essential insights. While the current platform does not support creating custom reports, you benefit from a user-friendly selection of reports that provide critical insights, ensuring you have reliable and ready-to-use data to help drive your decisions.
All data in Scilife is encrypted at all times, both in transit (between your browser and the platform) and at rest (when data is stored).
Scilife runs in the Amazon AWS cloud, which is still considered the best cloud infrastructure provider according to Gartner’s magic quadrant, and complies according to a plethora of regulations. We encourage you to take a look at it here.
Each client receives their own separate database. Or better yet: each client receives 3 different environments (TEST, VAL and PROD) and for each environment, they get a separate database. In other words, data from different clients is never sitting in the same database.
The Scilife platform runs in a VPC (virtual private cloud), which effectively separates it from the rest of the Amazon AWS clients. The VPC is divided into a 3-tier system: application servers, database servers, and file storage are separated, which makes it easier to scale out automatically when demand increases and therefore ensures a speedy user experience.
Besides the standard automated backups of client data, we use many different Amazon AWS services to ensure data integrity, and application reliability and to have robust disaster recovery mechanisms in place.
Data security and data integrity are aspects that we take very seriously, as we are aware that your business depends on them. And ours too!
Yes, with the Groups functionality, you can configure which users have access to which reports. This ensures that sensitive information is only accessible to appropriate personnel.
On the other hand, you can control which functionality modules users can see within the KPI dashboard, depending on the specific modules they are authorized to access in Scilife.
Please note that it is not possible to restrict access to specific reports based solely on Groups. Instead, access is managed through module permissions and data visibility settings.
Yes, there are 4 types of users in Scilife: administrators, managers, regular users, and read-only users. The first 3 user types can edit and participate in the approval workflow, the read-only user type can only read documents and mark them as Read&Understood.
EMEA Office
Louizalaan 489
1050 Brussels
Belgium
US Office
Scilife Inc.
228 E 45th St. RM 9E
New York, NY 10017
PRODUCT
RESOURCES
COMPANY
Contact Us
EMEA Office
Louizalaan 489
1050 Brussels
Belgium
US Office
Scilife Inc.
228 E 45th St. RM 9E
New York, NY 10017
Copyright 2025 Scilife N.V. All rights reserved.